With the availability of the 2020 census data fast approaching followed by the apportionment of congressional and state legislative districts, I decided to take the time to familiarize myself with some of the data already available, its format, how to acquire it, and some of the obstacles.
New York’s 23rd Congressional District
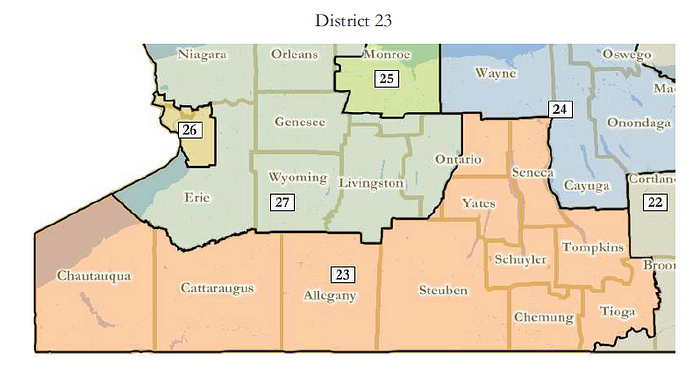
To make the exercise manageable, I decided to focus on my home congressional district, New York’s 23rd. The current configuration of the 23rd district went into effect in 2013 after the redistricting process following the 2010 census. The redistricting process following each decennial census is often fraught and can be manipulated for partisan ends.
Get the Data From data.census.gov
Data from the US Census is available at data.census.gov. There is a considerable amount of information available, but I will just get some population data for NY’s 23rd.
Once you are at data.census.gov, click View Tables. The default is data for the entire US. To get the data I want, I will click Filter at the top of the left hand column. A new window will popup and the filter that I want is Geography >>> Congressional District >>> New York >>> Congressional District 23, New York. Next go back to the Browse Filters column, and select Topics >>> Populations and People.
Now there is new data being displayed. It shows all the Age and Sex data for NY’s 23rd Congressional District using one year estimates for 2019. Estimates going back to 2010 are available for both one year and five year estimates. I want to look at the most recent estimates, which is why I chose 2019 one year estimates. To better understand the difference here is an explanation provided by the Census Bureau.
Now that I found the data I want, I need to download it. I go back to the left hand column and at the top I click Download. You will be asked to select which tables you want, I just want the Age and Sex table, so I select that and then click Download Selected. You will again have to select the years you want for the data, in my case 2019 1-year, select .csv for the file type and click Download. The files will be prepared for download and then you have to click Download Now and then finally you will receive them.
Explore the Census Data
After all that, I have the data file and it’s time to check it out. I’ll load it into a Pandas DataFrame check out its .info().
df = pd.read_csv(data_file)
df.info()<class 'pandas.core.frame.DataFrame'>
RangeIndex: 3 entries, 0 to 2
Columns: 458 entries, GEO_ID to S0101_C06_038M
dtypes: object(458)
memory usage: 10.9+ KB
If you took a look at the data displayed on the Census website, you will have noticed that was a lot of it and that it included Margin of Error data and Percent totals besides all the estimates, which resulted in 458 columns! That’s too many to work with at this point so I selected a few which that may be useful for understanding the district. A metadata file was included in the download and it can be referenced to more easily find the columns you want. In my case I wanted the ones for total population, total male, total female, total male 18 and over, and total female 18 and over. I was interested in the 18 and over subset, because that is the voting age population.
cols_of_interest = ['NAME',
                    'S0101_C01_001E',
                    'S0101_C01_026E',
                    'S0101_C03_001E',
                    'S0101_C03_026E',
                    'S0101_C05_001E',
                    'S0101_C05_026E']census_df = df[cols_of_interest]
census_df.info()<class 'pandas.core.frame.DataFrame'>
RangeIndex: 3 entries, 0 to 2
Data columns (total 7 columns):
 #   Column          Non-Null Count  Dtype
---  ------          --------------  -----
 0   NAME            3 non-null      object
 1   S0101_C01_001E  3 non-null      object
 2   S0101_C01_026E  3 non-null      object
 3   S0101_C03_001E  3 non-null      object
 4   S0101_C03_026E  3 non-null      object
 5   S0101_C05_001E  3 non-null      object
 6   S0101_C05_026E  3 non-null      object
dtypes: object(7)
memory usage: 296.0+ bytes

Seven columns is much easier to deal with for an initial exploration. The column titles aren’t the best, but I’ll leave them like that for now. All the numeric data was imported as strings and they need to be converted to int’s to do any analysis. Because I’m keeping the current column titles and the more descriptive titles in row zero, I need to ignore row zero when doing the conversion. For each column except for Name and except for row[0] convert the strings to numeric.
for col in cols_of_interest[1:]:
    census_df.loc[1:, col] = pd.to_numeric(census_df.loc[1:, col])
Now I have some population data for the district that I can work with, however because I’m interested in the redistricting process, I’d also like some data on the registered voters in the district and that is not available from the Census Bureau. It has to be obtained from each state separately and depending upon what data you want, you may have to go do separate counties.
Gather Party Registration Data from the NY BOE
There isn’t a national elections bureau, so I needed do go to the New York Board of Elections do get the data. I wanted the most recent data so I chose data from 11/01/2020. It’s provided as an excel file, however data from 2018 back is saved as pdf’s. While an excel file is much easier to use than a pdf, this one still couldn’t just be loaded into a dataframe. It contained two title rows that I removed manually prior to loading the data.
boe_df = pd.read_excel(boe_data_file, sheet_name='CD Enrollment November 2020')boe_df.head()

As you can see above, the dataframe is full of NaN rows that needed to be removed.
# Drop rows that are all NaN
boe_df.dropna(how='all', inplace=True)
An additional cleaning step was needed to remove trailing spaces in the COUNTY column.
boe_df['COUNTY'] = boe_df['COUNTY'].str.strip()I want to focus on the 23rd district so I filtered for that and then filtered for an active status. Active vs. inactive statuses is a bit confusing. It doesn’t mean people actively voting vs. those that aren’t. Active means allowed to vote and inactive means someone that is registered but is not allowed to vote for some reason.
boe_23_df = boe_df[boe_df['DISTRICT'] == 23.0]boe_23_active_df = boe_23_df[boe_23_df['STATUS'] == 'Active']
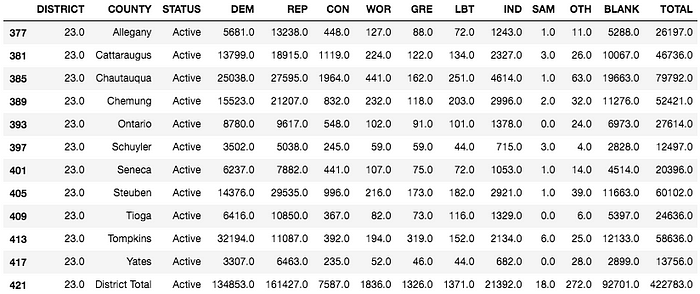
A quick look at the data shows that the party registration totals comparing Democrats vs. Republicans is lopsided and that every county but one has more Republicans than Democrats. A visualization of this is below.
# Use .iloc[:-1] to ignore the TOTAL column
boe_23_active_df.iloc[:-1].plot.bar(x='COUNTY',
                          y=parties,
                          stacked=True,
                          figsize=(16, 8),
                          title='Active Voters by Party in each County in NY23',
                          grid=True)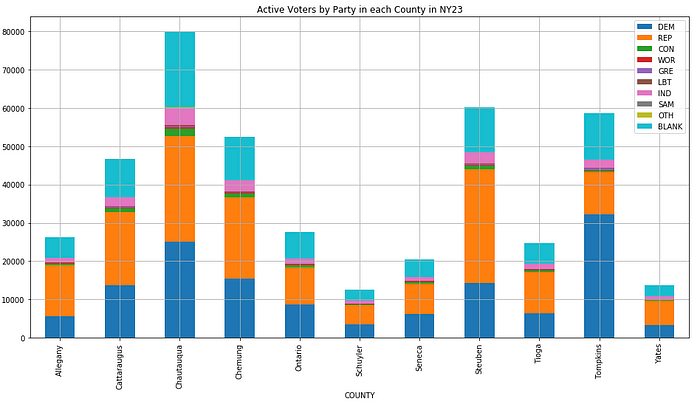
It should be noted that the third largest group is “BLANK”, which is voters with no party affiliation (independent).
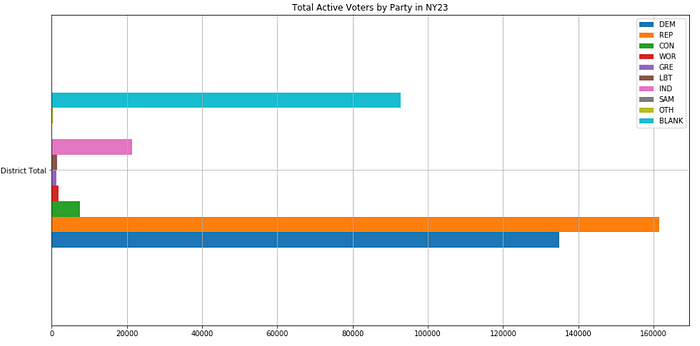
It’s beyond the scope of this blog post, but for someone wondering if this district is “fair” and “competitive”, how would they know. There are more Republicans than Democrats, but what about all those independent voters? Depending on their voting tendencies, this district could be competitive or it could still be lopsided in one way or another.
Another thing to note is that the IND party (Independence), indicated in pink, is know to have an outsized popularity because some voters mark it as their party when registering thinking that they are selecting independent/non-affiliated, which would likely push the actual independents over 100K in the district.
Election Results and Turnout by Party Registration
Next I want to drill down to look at the results of an election and the number of voters by party in a specific county, Tompkins. While some election results data is available on the NY BOE site, the more detailed data that I’m looking for has to be retrieved from the Tompkins County BOE. The results and turnout data for 2020 can be found here.
Tompkins County isn’t as helpful as the Census Bureau, or even the NY BOE, the data here is on pdf’s. I will attempt to convert the tables on the pdf’s to csv’s in the future, but for this exercise, I transcribed the totals and created a dataframe that included the number of votes for each candidate on each party line as well as the turnout for registered members of that party.
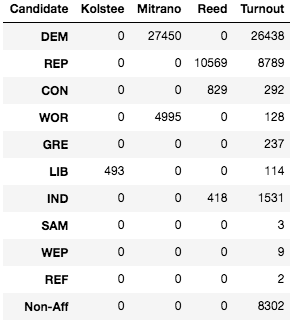
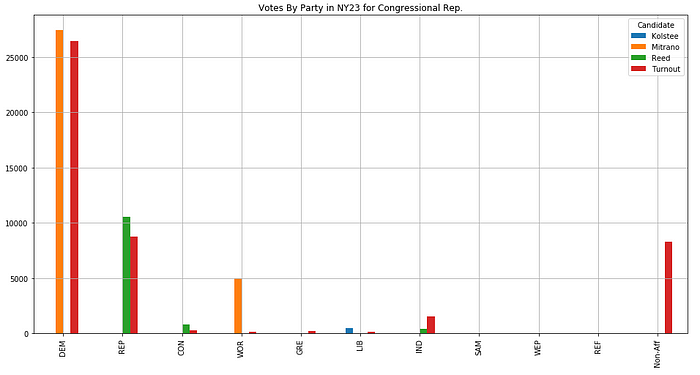
Looking at the above dataframe and visualization, a couple of things can be noted. The number of votes that a party endorsed candidate receives does not equal the amount of votes for that candidate. This is because a person doesn’t have to vote according to their registration and because the non-affiliated voters votes have to go somewhere.
Just getting started
Getting data about New York’s 23rd Congressional District in this exercise required going three places for data, and that didn’t include getting data for the counties in the 23rd besides Tompkins.
While I gained some understanding of the district, I don’t know if this is a good district, that would require more data and modeling statewide districts in an attempt to ascertain if this is a good district by some metric(s).
I help this exercise was helpful, I plan to dive deeper into redistricting in the future.
